
MATLAB Plot Formatting - Line Types, Market Types, and Colors
In the last post, I introduced the basics of MATLAB plots. Now I'd like to show you some very simple MATLAB plot formatting options. These include options for changing the color of plot lines, the type of line, and the type of markers. In the next post, we will finish our discussion of 2D plots by seeing how how we can handle multiple MATLAB plots on the same axis and in the same figure.
MATLAB Plot Colors, Line Type, and Marker Type
The MATLAB plot() function can actually take an additional third input that tells it what color, what type of line, and what type of marker ("dot" on each point) to use. This input is given in the form of a string (enclosed in single quotation marks) that can contain up to three letters/symbols. These correspond to the color, line type, and marker type. Some of the options for these are given in the table below.
| Color | Line Type | Marker Type |
|---|---|---|
| b blue | - solid | . point |
| g green | : dotted | o circle |
| r red | -. dash dot | x x-mark |
| c cyan | -- dashed | + plus sign |
| m magenta | (none) no line | * star |
| y yellow | s square | |
| b black | d diamond | |
| v triangle (down) | ||
| ^ triangle (up) |
By using combinations of the choices above for the third input to plot() you can format how you want the plot to look. Note that you can leave some options out, for example no marker type option indicates no markers or no line type option will not plot the line, only the specified markers! Also, the order of the options in the string input does not matter.
In addition, you can control the size of the line and markers by including additional pairs of inputs to plot(). To change the width of the line, you can include the string 'LineWidth' as the fourth input and an integer value for the width of the line as the fifth input. Alternatively, to change the size of markers, you can use 'MarkerSize' as the fourth input and an integer value for the desired size as the fifth input. Finally, to change both attributes, you would use one pair as the fourth/fifth inputs and the other pair as the sixth/seventh inputs to plot().
This may be a lot at once, but take a look at the following example where I show it should be straightforward to see the effect of each option on the resulting plots.
Example of Plot Formatting
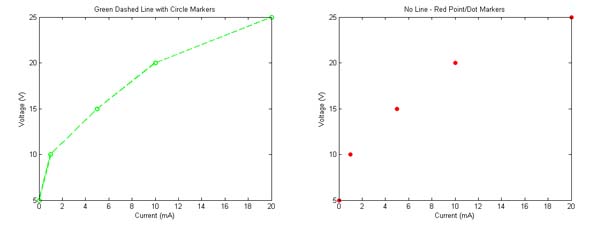
The following code will create two plots of the same data. The first plot will have a green dashed line with circle markers and the second plot will have only red points/dots for markers showing the data.
Note that I have specified additional options to change the sizes of the lines and markers in each case as described above. These extra fourth/fifth inputs to plot() are completely optional. If you leave them out, MATLAB will just use default values. They can just give you some extra control of your plots if you desire.
current = [0 1 5 10 20]; voltage = [5 10 15 20 25]; figure plot(current,voltage,'g--o','LineWidth',2) title('Green Dashed Line with Circle Markers') xlabel('Current (mA)') ylabel('Voltage (V)') figure plot(current,voltage,'r.','MarkerSize',20) title('No Line - Red Point/Dot Markers') xlabel('Current (mA)') ylabel('Voltage (V)') |
Lets now finish off our introduction to plotting in MATLAB by seeing how to handle multiple plots either on the same axis or on different sets of axes in the same figure: Multiple Plots in MATLAB.